Marketers love share of voice. Sales lives on share of shelf. The truth about which one actually moves volume — and why measuring both weekly matters more than either alone.
Marketers love share of voice. Sales lives on share of shelf. Both camps genuinely believe they've picked the more predictive metric — and both are half right. The brands measuring both weekly (not quarterly) are the ones growing two to three times faster than their peers.
Definitions, so we're arguing about the same thing
- Share of voice (SOV): your brand's share of category media impressions — TV, digital, social, retail media.
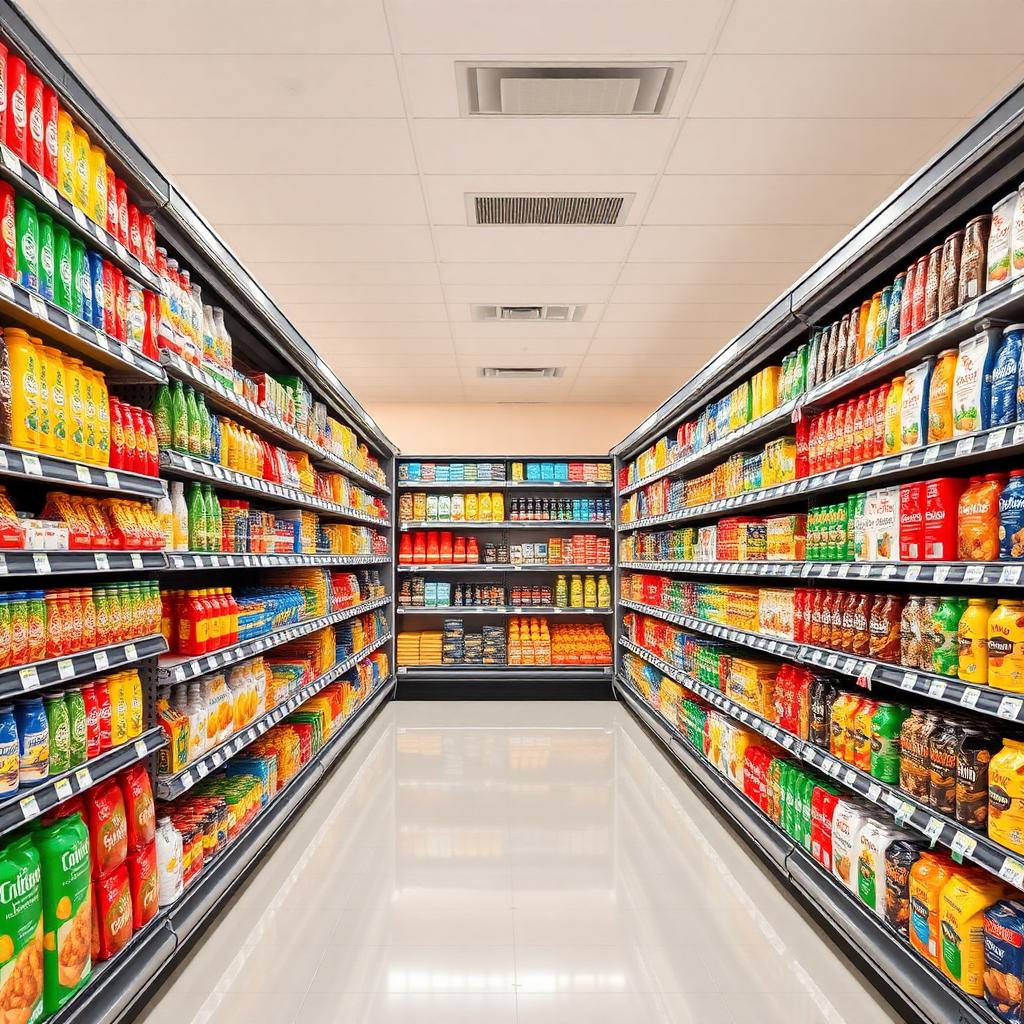
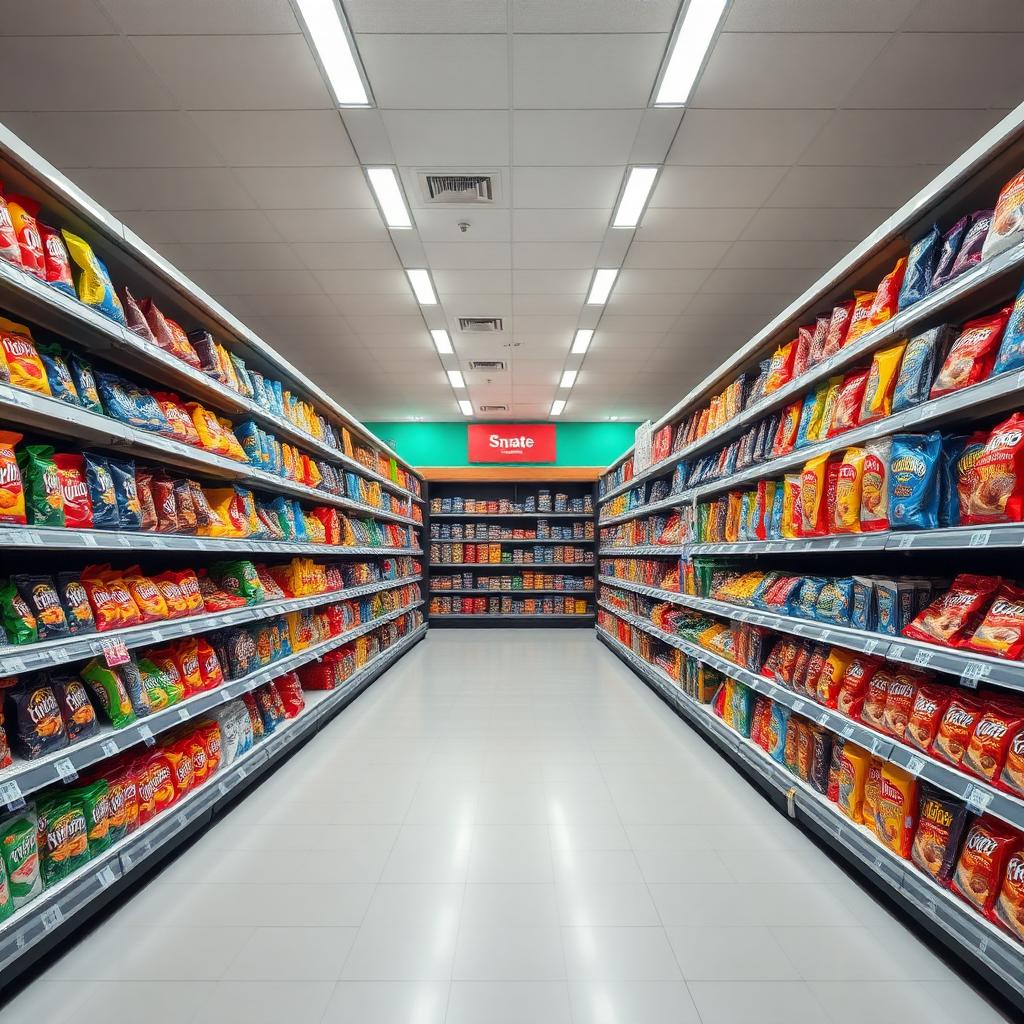
- Share of shelf (SOS): your brand's share of category facings or linear feet on the physical shelf.
Both are shares. Both correlate to volume. They correlate differently.
What the research actually says
The most robust body of evidence — Byron Sharp, the Ehrenberg-Bass Institute, and follow-on academic work — supports the "excess share of voice" hypothesis: brands whose SOV exceeds their market share tend to grow. That's real and worth respecting.
But the SOV research was built in an era of mass media dominance. It assumed the product was findable at retail. In today's crowded categories, that assumption is shakier than the industry admits. If your shopper walks into the aisle looking for you and can't find you, no amount of SOV recovers that trip.
The best current view: SOV drives category demand, SOS captures it. Under-invest in either and you leak.
Why SOS moves volume in ways SOV can't
- Point-of-decision. 76% of purchase decisions in CPG happen in-store. SOS is the metric closest to that decision.
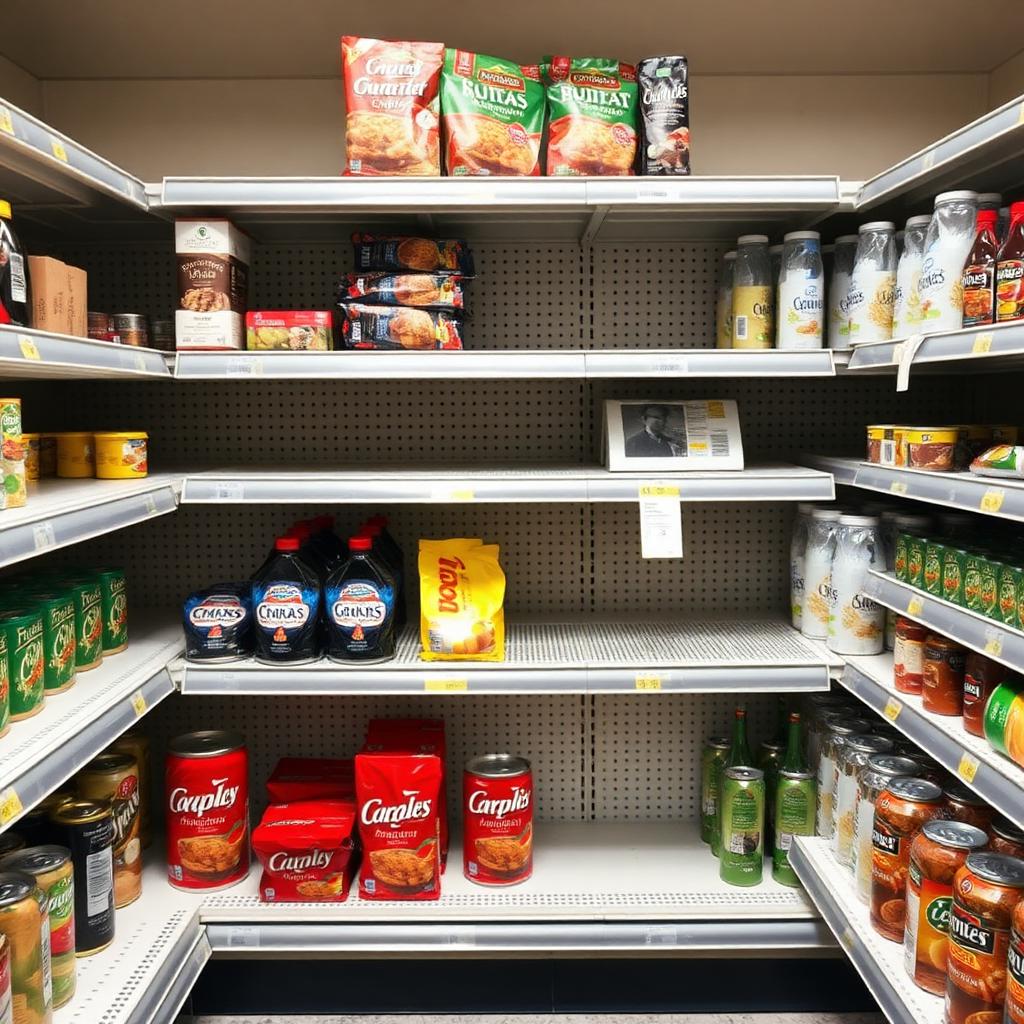
- Physical availability. No amount of upstream demand converts if the shopper can't find or grab the product.
- Retailer signaling. Retailers reward SOS growth with more SOS. It compounds.
- Speed of feedback. SOV impact takes quarters to model. SOS impact shows up in the next scan-data cycle.
Why SOV still matters
- Category expansion. Grows the pie; SOS alone just slices it.
- New-product awareness. Shoppers won't reach for what they've never heard of.
- Brand equity. SOV underwrites the pricing power that keeps margins healthy.
Neither is optional. The mistake is picking a lane.
How to measure both operationally
SOV is straightforward if you have media agency reporting — most brands have this locked.
SOS is where the operational gap lives. Traditional SOS measurement relies on retailer POGs (aspirational, not actual) or one-off shopper studies (expensive, infrequent). Neither reflects what's on the shelf this week.
Modern SOS measurement uses:
- AI-tagged in-store captures that automatically compute facing shares by category, brand, and store
- Weekly refresh cycles so trends are visible in-flight
- Segment cuts — SOS by chain, region, format, planogram version
That's the layer Shelfies.ai provides.
Turning both into one growth conversation
When SOV and SOS trend lines sit on the same dashboard, planning conversations change:
- Regions with rising SOV but flat SOS → shelf negotiation problem, not a media problem
- Regions with strong SOS but flat share → media pressure problem
- Regions where both trend down → strategic reset, not a tactical fix
Any conversation that treats these two as separate silos misses the pattern.
Key takeaways
- SOV drives category demand; SOS captures it. Both matter.
- 76% of CPG purchase decisions happen in-store — SOS lives closest to the decision.
- Weekly SOS measurement is the operational gap for most brands.
- Trending SOV and SOS together turns two debates into one growth conversation.
FAQ
How is share of shelf best measured today? Continuous AI-tagged capture of category facings by store, computed weekly. Snapshot studies and planogram-based estimates are directionally useful but not decision-grade.
What's a healthy SOS-to-market-share ratio? Category leaders generally hold SOS at or slightly above their market share. Under-index sustained is a leading indicator of share loss. Benchmark yours.